Note
Go to the end to download the full example code.
Compare results using the plotter#
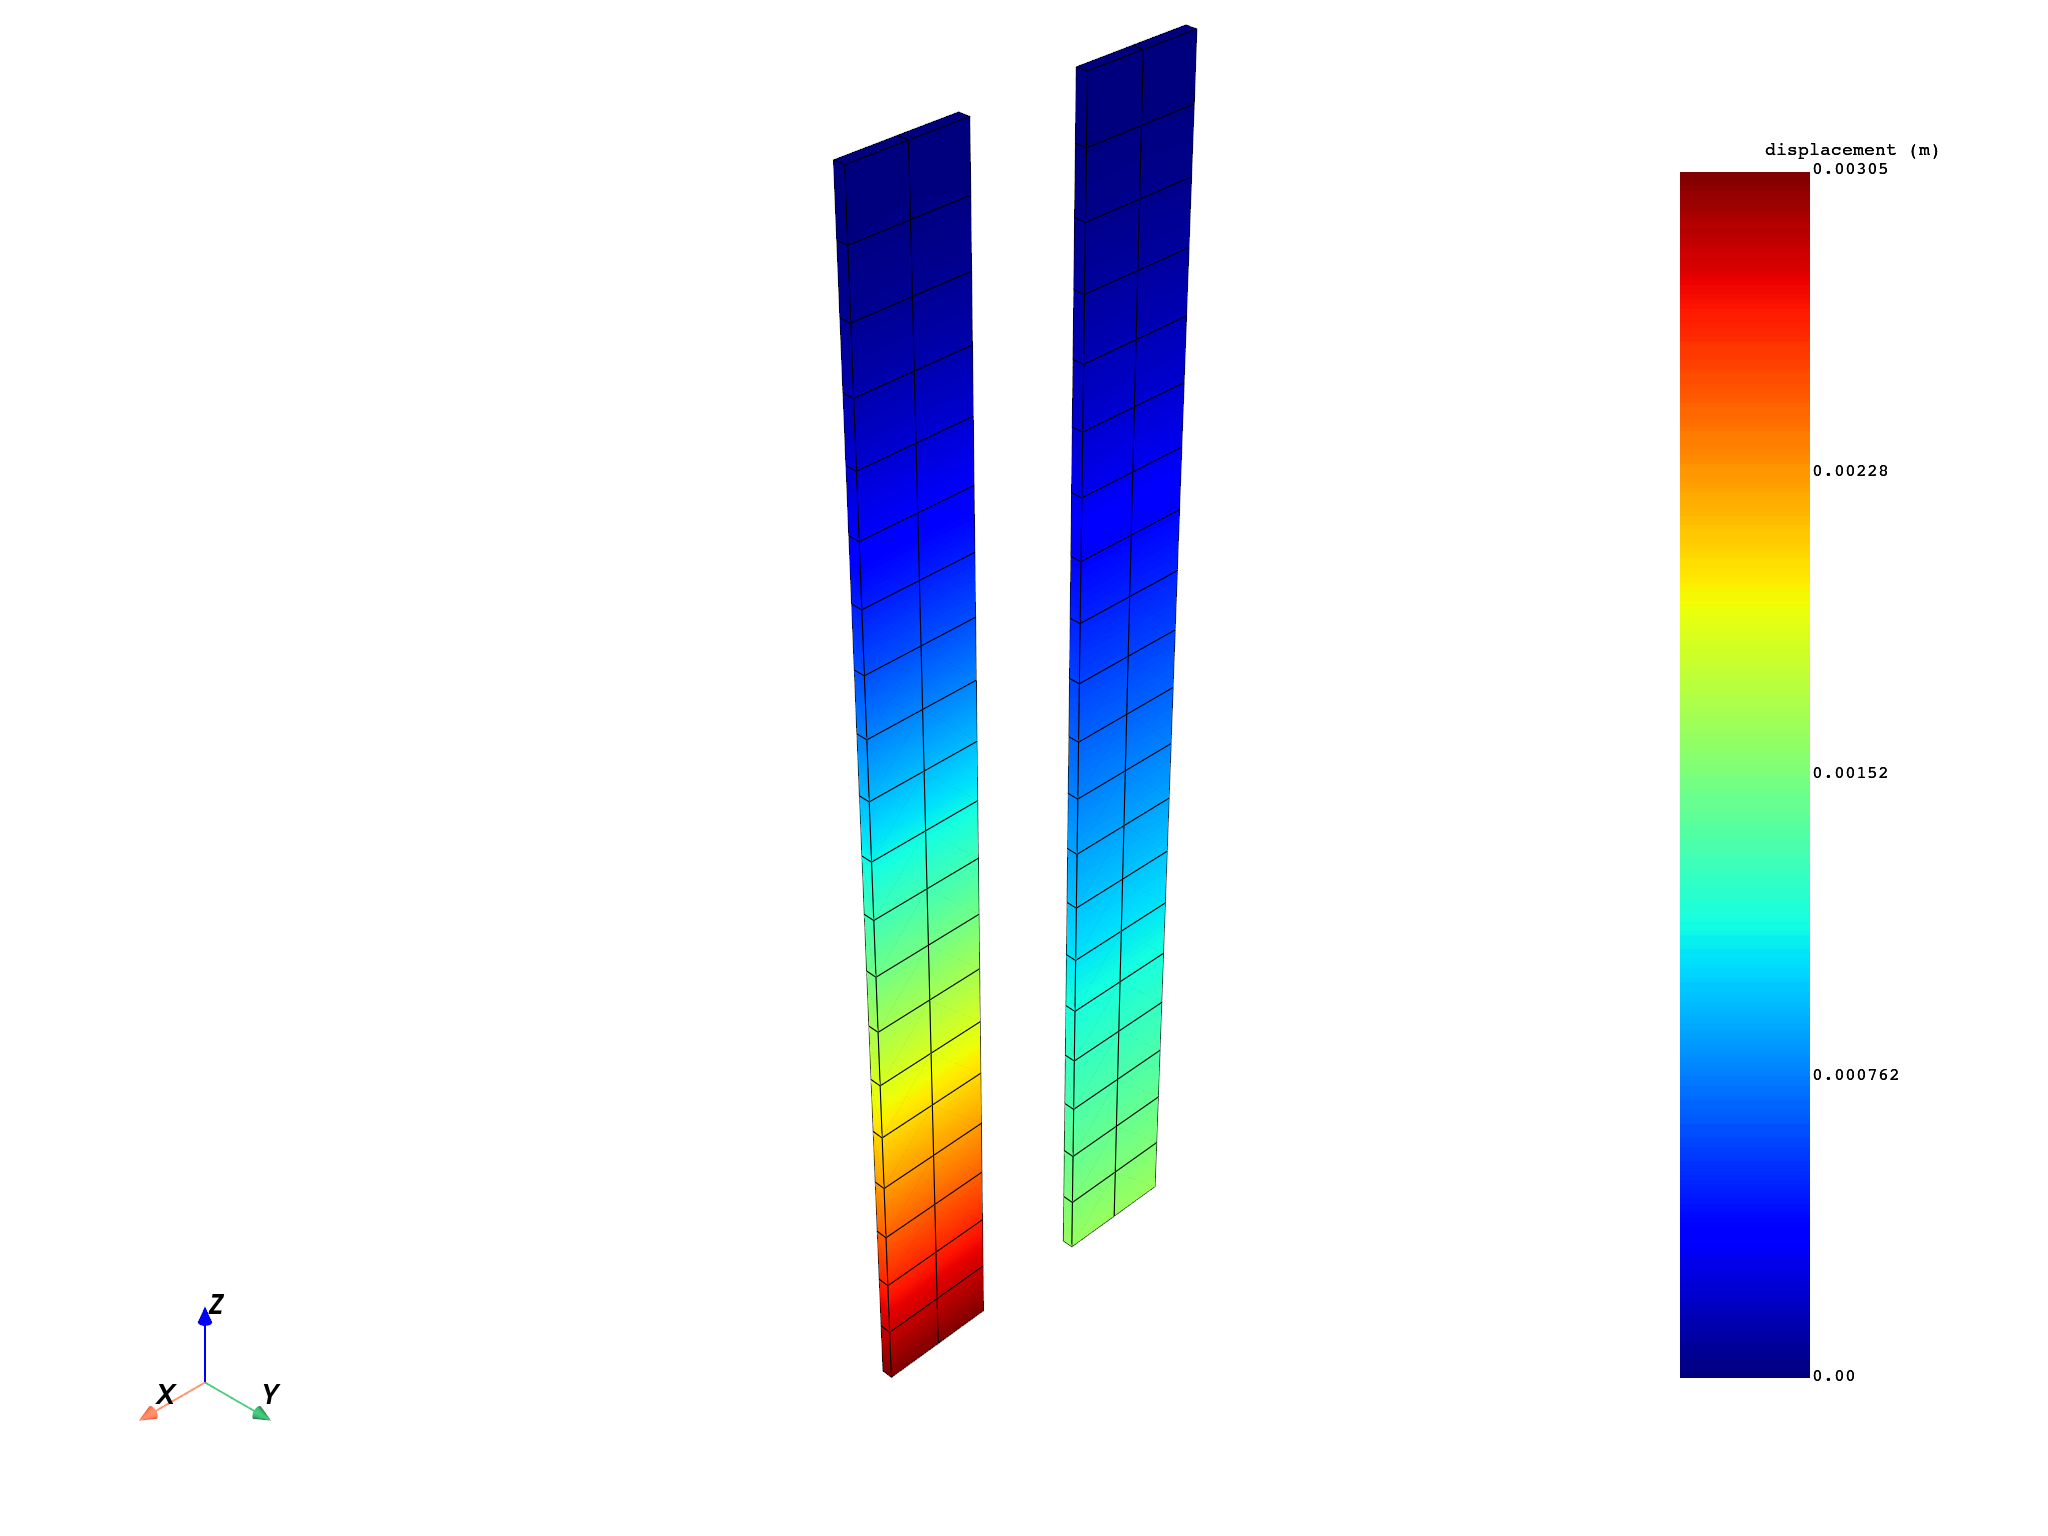
This example shows how to plot several mesh/result combinations on the same plot so that you can compare results at different time steps.
from ansys.dpf import core as dpf
from ansys.dpf.core import examples
from ansys.dpf.core.plotter import DpfPlotter
Compare two results#
Use the ansys.dpf.core.plotter.DpfPlotter class to plot two different
results over the same mesh and compare them.
# Here we create a Model and request its mesh
model = dpf.Model(examples.find_msup_transient())
mesh_set2 = model.metadata.meshed_region

# Then we need to request the displacement for two different time steps
displacement_operator = model.results.displacement()
displacement_operator.inputs.time_scoping.connect([2, 15])
displacement_set2 = displacement_operator.outputs.fields_container()[0]
displacement_set15 = displacement_operator.outputs.fields_container()[1]
Use the ansys.dpf.core.plotter.DpfPlotter class to add plots for the
first mesh and the first result.
pl = DpfPlotter()
pl.add_field(displacement_set2, mesh_set2)

# Create a new mesh and translate it along the x axis.
mesh_set15 = mesh_set2.deep_copy()
overall_field = dpf.fields_factory.create_3d_vector_field(1, dpf.locations.overall)
overall_field.append([0.2, 0.0, 0.0], 1)
coordinates_to_update = mesh_set15.nodes.coordinates_field
add_operator = dpf.operators.math.add(coordinates_to_update, overall_field)
coordinates_updated = add_operator.outputs.field()
coordinates_to_update.data = coordinates_updated.data

# Use the :class:`ansys.dpf.core.plotter.DpfPlotter` class to add plots for the
# second mesh and the second result.
pl.add_field(displacement_set15, mesh_set15)
pl.show_figure(show_axes=True)

Total running time of the script: (0 minutes 0.420 seconds)