Note
Go to the end to download the full example code
绘图和网格访问#
PyMAPDL 可以加载基本的 IGES 几何图形进行分析。
本示例演示了如何将基本几何图形加载到 MAPDL 中进行分析,并演示了如何使用内置的 Python 特定绘图功能。
该示例还演示了 PyMAPDL 的一些更高级功能,包括通过 VTK 直接访问网格。
import numpy as np

from ansys.mapdl import core as pymapdl
from ansys.mapdl.core import examples

mapdl = pymapdl.launch_mapdl()
E:\venv\pymapdl-venv\lib\site-packages\ansys\tools\path\path.py:1035: DeprecationWarning: This method is going to be deprecated in future versions. Please use 'get_mapdl_path'.
  warnings.warn(
Load Geometry#
在这里,我们下载一个简单的支架 IGES 文件并将其加载到 MAPDL 中。注意 igesin 必须在 AUX15 进程中。
# 注意,该方法只返回文件路径
bracket_file = examples.download_bracket()

# 加载支架,然后打印几何图形
mapdl.aux15()
mapdl.igesin(bracket_file)
print(mapdl.geometry)
MAPDL Selected Geometry
Keypoints:  188
Lines:      185
Areas:      73
Volumes:    1
Plotting#
PyMAPDL 使用 VTK 和 pyvista 作为绘图后端,以实现远程(使用 2021R1 及更新版本)交互式绘图。
常见的绘图方法 (kplot , lplot , aplot , eplot 等) 都有相应 ansys.mapdl.core.plotting.general_plotter() 函数
的兼容命令。您可以使用各种关键字参数配置此方法。例如:
mapdl.lplot(
    show_line_numbering=False,
    background="k",
    line_width=3,
    color="w",
    show_axes=False,
    show_bounds=True,
    title="",
    cpos="xz",
)

您还可以配置一个主题,以便在多个绘图中实现一致的绘图。这些主题参数会覆盖所有未设置的关键字参数。例如
my_theme = pymapdl.MapdlTheme()
my_theme.background = "white"
my_theme.cmap = "jet"  # colormap
my_theme.axes.show = False
my_theme.show_scalar_bar = False

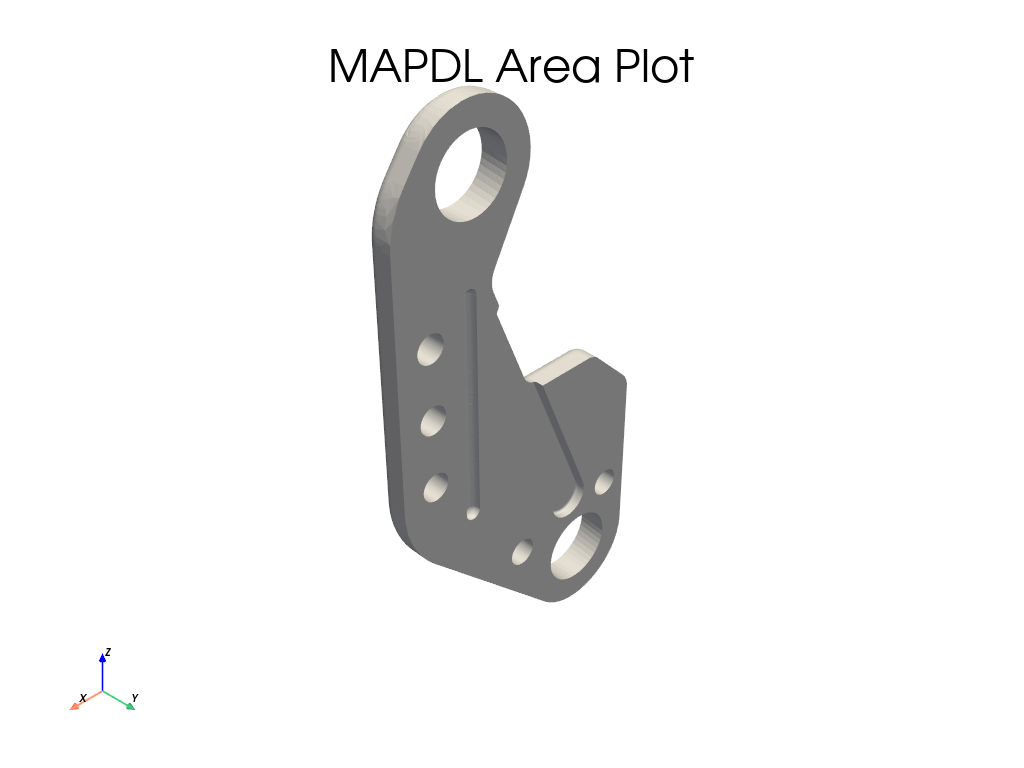
mapdl.aplot(theme=my_theme, quality=8)

Accessesing Element and Nodes Pythonically#
PyMAPDL 还支持使用 eplot 和 nplot 绘制单元和节点图。首先,使用 SOLID187 单元对支架进行网格划分。这些单元非常适合这种几何形状和静态结构分析。
# 设置前处理器、单元类型和大小,并对几何体进行网格划分
mapdl.prep7()
mapdl.et(1, "SOLID187")
mapdl.esize(0.075)
mapdl.vmesh("all")

# 打印网格特征
print(mapdl.mesh)
ANSYS Mesh
  Number of Nodes:              50693
  Number of Elements:           32203
  Number of Element Types:      1
  Number of Node Components:    0
  Number of Element Components: 0
您可以通过 mesh.grid 属性以 VTK 网格的形式访问底层有限元网格。
这个 UnstructuredGrid 包含一个功能强大的 API,包括访问节点、单元和原始节点编号的功能,所有这些功能都可以绘制网格,并为网格添加新的属性和数据。
grid.points # same as mapdl.mesh.nodes
pyvista_ndarray([[-2.03111884e-01, -5.87401575e-02,  4.44426114e-04],
                 [-2.03111884e-01,  0.00000000e+00,  4.44426114e-04],
                 [-2.03111884e-01, -2.93700787e-02,  4.44426114e-04],
                 ...,
                 [ 2.95456812e-01, -1.15526255e-01,  7.79245883e-01],
                 [-3.86538371e-01, -1.22594848e-01, -3.49182457e-01],
                 [ 3.09262991e-01, -1.15288217e-01,  7.81784922e-01]])
以 VTK 格式表示的单元格
array([ 10, 1236, 15212, ..., 20943, 20945, 50050], dtype=int64)
获取网格的节点编号
grid.point_data["ansys_node_num"]
pyvista_ndarray([ 1, 2, 3, ..., 50691, 50692, 50693])
将任意数据保存到网格中
# 必须根据点数调整大小
grid.point_data["my_data"] = np.arange(grid.n_points)
grid.point_data
pyvista DataSetAttributes
Association     : POINT
Active Scalars  : ansys_node_num
Active Vectors  : None
Active Texture  : None
Active Normals  : None
Contains arrays :
    ansys_node_num          int32      (50693,)             SCALARS
    vtkOriginalPointIds     int64      (50693,)
    origid                  int32      (50693,)
    VTKorigID               int32      (50693,)
    my_data                 int32      (50693,)
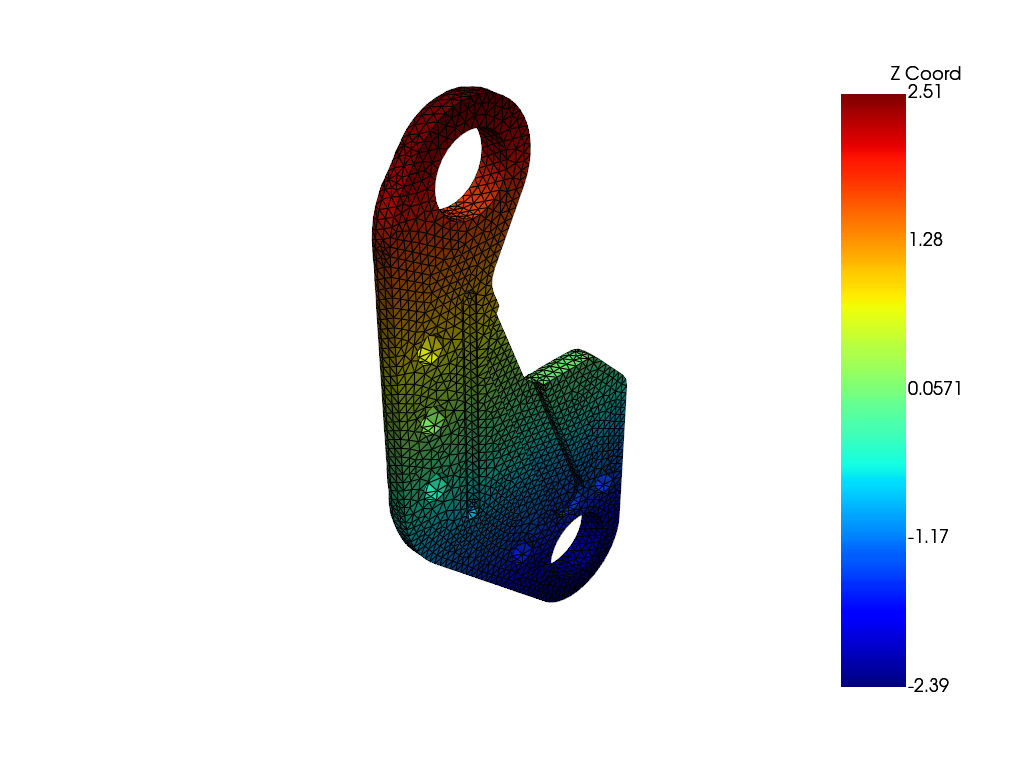
用您选择的标量绘制该网格。绘制时可以使用相同的 MapdlTheme,因为它与网格绘制器兼容。
# make interesting scalars
scalars = grid.points[:, 2]  # z coordinates

sbar_kwargs = {"color": "black", "title": "Z Coord"}
grid.plot(
    scalars=scalars,
    show_scalar_bar=True,
    scalar_bar_args=sbar_kwargs,
    show_edges=True,
    theme=my_theme,
)

该网格还能以紧凑的跨平台 VTK 格式保存到磁盘中,并再次用 pyvista 或 ParaView 加载。
grid.save('my_mesh.vtk')
import pyvista
imported_mesh = pyvista.read('my_mesh.vtk')
Stop mapdl#
mapdl.exit()
Total running time of the script: (0 minutes 28.263 seconds)