Note
Go to the end to download the full example code
将 CFX 压力数据映射到结构叶片#
本测试的目的是在 PyMAPDL 中演示 CFX 压力数据与 11 个叶片结构模型的映射。
Description#
对 11 个叶片模型和一个虚构的圆盘进行了建模。使用 CFX 生成的压力数据作为输入。
测试使用 CFX 导出的压力数据进行映射。压力文件对应于某种振动叶片模态(振动模态 1 约 534 Hz)和某种压力模态(压力模态 1 也是 534 Hz 模态)。 然而,由于缺乏其他模态的数据,同一文件将被假定为代表其他模态组合(振动模态 2 压力模态 2)(振动模态 1 压力模态 2)(振动模态 2 压力模态 1)。
from datetime import datetime

from ansys.mapdl.core import launch_mapdl
from ansys.mapdl.core.examples import download_cfx_mapping_example_data
Downloading files#
files_path = download_cfx_mapping_example_data()

db_file_path = files_path["model"]
pressure_file_path = files_path["data"]
Launch MAPDL service#
mapdl = launch_mapdl()

mapdl.title(
    "Verify Pressure Data Mapping exported from CFX on Structural 11 Blade Model"
)
TITLE=
 Verify Pressure Data Mapping exported from CFX on Structural 11 Blade Model
Upload files to the instance#
Uploading files
mapdl.upload(db_file_path)
mapdl.upload(pressure_file_path)
Uploading ExampleMapping.db:   0%|          | 0.00/24.6M [00:00<?, ?B/s]
Uploading ExampleMapping.db: 100%|██████████| 24.6M/24.6M [00:00<00:00, 458MB/s]

Uploading 11_blades_mode_1_ND_0.csv:   0%|          | 0.00/828k [00:00<?, ?B/s]
Uploading 11_blades_mode_1_ND_0.csv: 100%|██████████| 828k/828k [00:00<00:00, 89.1MB/s]

'11_blades_mode_1_ND_0.csv'
Pressure mapping#
Resume the database from the example mapping file
mapdl.resume("ExampleMapping", "db")
mapdl.esel("s", "type", "", 1)
mapdl.cm("BladeElem", "elem")

# Write CDB file
mapdl.allsel()
mapdl.cdwrite("all", "baseModel", "cdb")
mapdl.finish()

# Start the mapping processor and record the start time
start_time = datetime.now()
mapdl.slashmap()  # mapdl.slashmap(**kwargs); Enters the mapping processor.
print("Enter the Mapping Processor")

# Specifies the target nodes for mapping pressures onto surface effect elements.
mapdl.run("target,pressure_faces")

# Specifies the file type and pressure type for the subsequent import of source points and pressures.
mapdl.ftype(filetype="cfxtbr", prestype="1")
# Read the CFX exported file containing pressure data Blade 2, Export Surface 1
mapdl.read(fname="11_blades_mode_1_ND_0.csv")

# Perform the pressure mapping from source points to target surface elements.
# Interpolation is done on a surface (default).
print(mapdl.map(kdim="2", kout="1"))
Enter the Mapping Processor
MAP SOURCE DATA TO TARGET NODES
  INTERPOLATE ON A SURFACE
  MAXIMUM NUMBER OF NEAREST POINTS TO EXAMINE=  20
  SET RESULTS OUTSIDE OF REGION TO ZERO

 NON-ZERO PRESSURES APPLIED TO  9963 TARGET FACES (OUT OF 10622 DEFINED BY SURF154s)
  MIN REAL PRESSURE =  -2816.        MAX REAL PRESSURE =   4408.
  MIN IMAG PRESSURE =  -5189.        MAX IMAG PRESSURE =   5754.
Plot mapping#
Plot the geometries and mappings
mapdl.show("png,rev")
mapdl.plgeom(item="BOTH")  # Plot both target and source geometries (default).
mapdl.plmap(item="target")
mapdl.plmap(item="target", imagkey="1")
mapdl.plmap(item="source")
mapdl.plmap(item="source", imagkey="1")
mapdl.plmap(item="both")
mapdl.plmap(item="both", imagkey="1")

# Close the plot and write the mapped data to a file
mapdl.show("close")
mapdl.writemap("mappedHI.dat")

# Print the mapping completion message and duration
print("Mapping Completed")
end_time = datetime.now()
c = end_time - start_time
seconds = c.total_seconds()
print("\nDuration in seconds for Mapping is  : ", seconds)

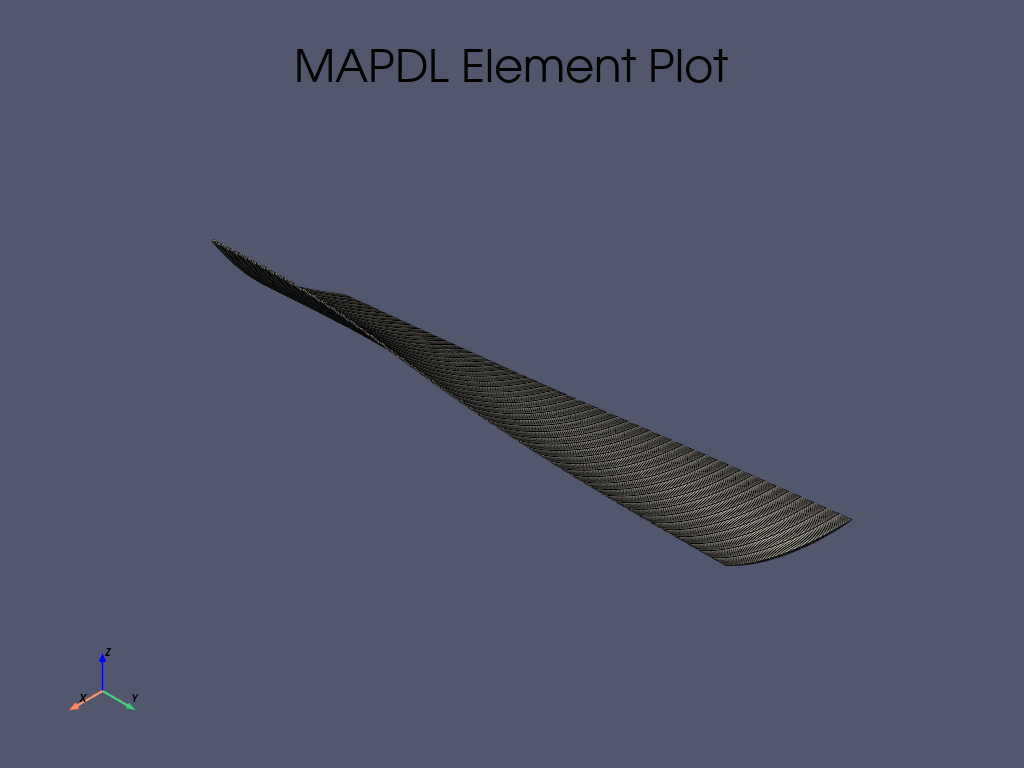
mapdl.eplot()

Mapping Completed

Duration in seconds for Mapping is  :  1.904171
Stop MAPDL
mapdl.finish()
mapdl.exit()
Total running time of the script: (0 minutes 2.990 seconds)